Further Reading
General strategies
Before wracking your brain trying to solve an obscure problem, it's always best to eliminate the easy stuff first-- and get rid of any old cached files that might be hanging around. Remeber that a couple different cache layers may be coming into play when you're developing a site.
Disable the site cache
When troubleshooting any problem with concrete5, it’s highly advisable to make sure the site cache is cleared and disabled. This will make sure your site isn’t trying to load any outdated or expired resources. In fact, we we recommend you leave the cache disabled as you build out content and put the finishing touches on a site. You can find cache settings at:
Dashboard > System & Settings > Optimization > Cache & Speed Settings
Clear your browser cache
Clearing cached files and cookies from your browser also warrants mention-- if you’re confounded by site behavior that doesn’t seem to make sense, this can be a very helpful step to take.
Debug Settings
Your concrete5 site can be set to suppress php errors or show them. If your site displays a blank page, or if you suspect a PHP error is occurring but can't find it in your HTML source, it’s very likely that the message is being suppressed. To see the error, go to:
Dashboard > System & Settings > Environment > Debug Settings
And select “Show Errors in Page”. Often simply seeing the error message displayed on the page will give you enough information to at least look into the problem deeper.
If the error is preventing you from accessing the Dashboard, you can always set the debug level through database with the following query:
UPDATE Config SET cfValue = 1 WHERE cfKey = 'SITE_DEBUG_LEVEL';
Logged Errors
Errors encountered by your site can be logged in the Dashboard. To enable error logging, go to:
Dashboard > System & Settings > Environment > Logging Settings
and make sure “Log Application Exceptions” is enabled.
To find the logs, go to:
Dashboard > Reports > Logs
Logged email messages
Email messages generated by the site are also stored in the Dashboard logs page. Filtering by Type: Sent Emails will list all messages. This can be helpful to see emails sent from the site from forms, password reset requests, etc.
Like error logs, email logging can be enabled by visting:
Dashboard > System & Settings > Environment > Logging Settings
Custom logging using the Log class
Adding a custom log entry is as easy as calling the addEntry method:
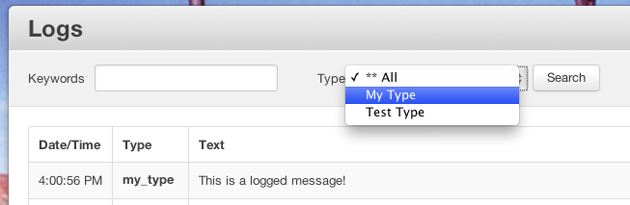
Log::addEntry('I wish to log this string.'); The first agument is our message. This will produce a new log entry with the generic type “debug”. If we want to give this message its own unique type / handle, simply specify it as the second argument:
Log::addEntry('This is a logged message!','my_type'); A simple way to test this is to run this code from a script in your tools directory. After accessing the file in a browser, we see a new entry added to the logs:
Logging multiple lines
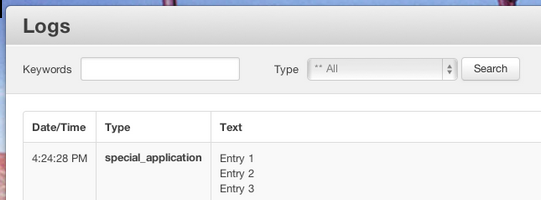
Here’s another example. This time, we’ll add multiple lines to the same log entry:
$l = new Log('special_application', true);
$l->write('Entry 1');
$l->write('Entry 2');
$l->write('Entry 3');
$l->close();